Understanding the Output File
The output of a Transition State Search contains two major stages:
- Transition State Optimization
- Frequency Analysis
Unlike a normal Geometry Optimization, the purpose of this calculation is not to locate an energy minimum, but rather to locate a first-order saddle point on the Potential Energy Surface (PES). Once the optimization converges, Gaussian automatically performs a Frequency Calculation to verify that the optimized structure is indeed a transition state.
The overall workflow is
Initial TS Guess
        │
        ▼
Transition State Optimization
        │
        ▼
Optimized Transition State
        │
        ▼
Frequency Calculation
        │
        ▼
Transition State Verification
Transition State Optimization
The first part of the output consists of the Transition State optimization.
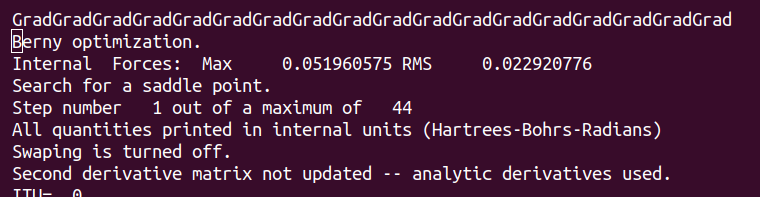
Gaussian uses the Berny optimization algorithm together with Rational Function Optimization (RFO) to search for a first-order saddle point.
The output contains messages similar to
During this stage,
Gaussian repeatedly
- evaluates the electronic energy,
- computes the energy gradient,
- updates the molecular geometry,
- approaches the transition state.
Although the optimization procedure resembles a normal Geometry Optimization, the optimization algorithm is specifically designed to converge to a saddle point rather than an energy minimum.
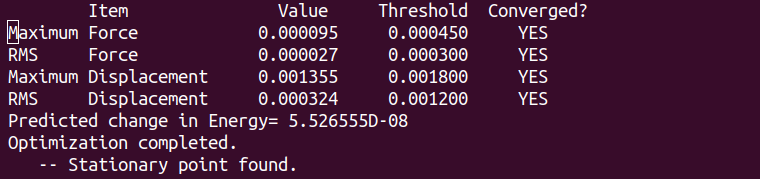
Optimization Convergence
Near the end of the optimization,
Gaussian prints the convergence table.
The optimization is considered successful only when every convergence criterion satisfies its corresponding threshold.
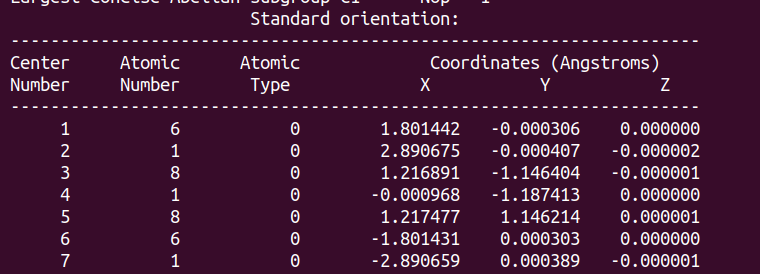
Optimized Transition State Geometry
After convergence,
Gaussian prints the optimized molecular geometry.
The Standard Orientation section contains the Cartesian coordinates of the transition state.
Unlike a minimum-energy structure,
these coordinates correspond to the highest-energy structure along the reaction pathway.
Final SCF Energy
Once the optimization has converged,
Gaussian reports the final electronic energy
This energy corresponds to the optimized transition-state structure.
Because a transition state lies at the top of the reaction barrier,
its energy is normally higher than that of both the reactants and products.

Frequency Calculation
Immediately after the optimization,
Gaussian automatically starts a Frequency Calculation using the optimized transition-state geometry.
This calculation verifies whether the optimized structure is actually a transition state.
For a detailed description of the Frequency Calculation procedure,
please refer to
See also
Frequency Calculation → Output File
Imaginary Frequency (Most Important Section)
The most important part of a Transition State calculation is the vibrational frequency table.
Gaussian reports
For a valid transition state,
the first frequency must be imaginary.
Gaussian prints imaginary frequencies as negative values, for example
The negative sign indicates that the corresponding eigenvalue of the Hessian matrix is negative.
This confirms that the optimized structure is a first-order saddle point.
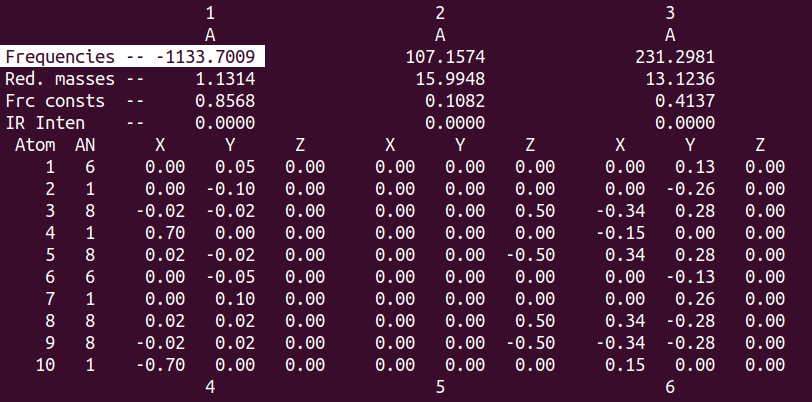
Number of Imaginary Frequencies
The number of imaginary frequencies determines the nature of the stationary point.
| Number of Imaginary Frequencies | Interpretation |
|---|---|
| 0 | Local minimum |
| 1 | Transition state (desired result) |
| 2 or more | Higher-order saddle point |
Exactly one imaginary frequency is required for a successful Transition State Search.
Transition-State Normal Mode
The imaginary frequency is associated with a particular normal mode.
This normal mode represents the reaction coordinate.
When animated in GaussView,
the atoms should move in the expected direction of the chemical reaction.
Typical observations include
- bond breaking,
- bond formation,
- proton transfer,
- hydrogen migration,
- molecular rearrangement.
Video 1. Demonstration of the Transition State Vibration.
If the animated vibration does not correspond to the expected reaction,
the optimized structure may not represent the desired transition state.
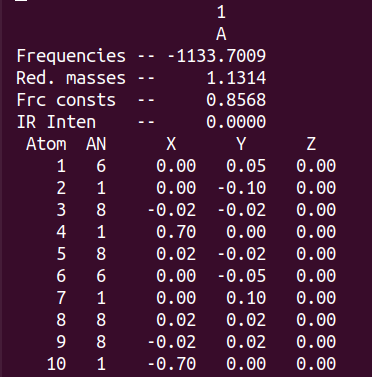
Figure 1. Normal Modes of Transition state Frequency.
Thermodynamic Properties
After the vibrational analysis,
Gaussian reports
- Zero-Point Energy (ZPE),
- Thermal corrections,
- Enthalpy,
- Entropy,
- Gibbs Free Energy.
These quantities are calculated exactly as described in the Frequency Calculation section.
See also
Frequency Calculation → Thermodynamic Properties
Normal Termination
A successful Transition State calculation ends with
This confirms that
- the optimization completed successfully,
- the frequency calculation completed successfully,
- all requested properties were calculated.
Checklist for a Successful Transition State
Before accepting a transition state, verify the following:
- ✅ Optimization converged successfully.
- ✅ Geometry is chemically reasonable.
- ✅ Final SCF energy is reported.
- ✅ Exactly one imaginary frequency is present.
- ✅ The imaginary normal mode corresponds to the expected reaction coordinate.
- ✅ Gaussian terminated normally.
Only when all of these conditions are satisfied can the structure be confidently identified as a valid transition state.
Summary
The output of a Transition State Search consists of a Transition State Optimization followed by a Frequency Calculation. The optimization locates a stationary point on the Potential Energy Surface, while the frequency analysis confirms its nature. The defining feature of a successful transition state is the presence of exactly one imaginary vibrational frequency, whose associated normal mode describes the reaction coordinate. Together with the optimized geometry and final electronic energy, these results provide a complete characterization of the transition state and form the basis for studying reaction mechanisms and activation energies.