Understanding the Geometry Optimization Output
After submitting the Geometry Optimization job, Gaussian generates an output file (.log or .out) containing detailed information about every optimization step. Unlike a Single Point Energy calculation, where only one electronic energy is computed, a Geometry Optimization performs many successive Single Point Energy calculations while gradually modifying the molecular geometry.
Although the output file may contain hundreds or even thousands of lines, only a few sections are essential for understanding whether the optimization has completed successfully.
This chapter explains the most important sections of the Geometry Optimization output.
1. SCF Energy During Optimization
During every optimization cycle, Gaussian performs a complete Self-Consistent Field (SCF) calculation and reports the electronic energy.
A typical output appears as
This line indicates
- the electronic structure method used (
RB3LYP), - the total electronic energy,
- the energy in Hartree (atomic units).
Since the molecular geometry changes after every optimization step, this energy also changes from one cycle to the next.
As the optimization progresses, the electronic energy generally decreases until a minimum on the potential energy surface is reached.
2. Optimization Progress
After each optimization step, Gaussian prints information about the current optimization cycle.
Typical output includes
or
Each optimization cycle consists of
- Performing an SCF calculation.
- Calculating the forces acting on the nuclei.
- Updating the molecular geometry.
- Checking whether the convergence criteria have been satisfied.
Large molecules may require dozens of optimization cycles before convergence.
3. Optimized Parameters
One of the most useful sections of the output is the list of optimized internal coordinates.
A typical section appears as
Here,
- R represents bond lengths,
- A represents bond angles,
- D represents dihedral (torsional) angles.
For example,
indicates the optimized bond length corresponding to the internal coordinate labeled R1.
These parameters describe the final optimized molecular structure in terms of chemically meaningful internal coordinates.
4. Convergence Criteria
After every optimization step, Gaussian checks whether the geometry has converged.
A typical convergence table is
Item                 Value       Threshold    Converged?

Maximum Force        ...
RMS Force            ...
Maximum Displacement ...
RMS Displacement     ...
Each quantity measures a different aspect of the optimization.
Maximum Force
The largest force acting on any atom.
RMS Force
The average force acting on all atoms.
Maximum Displacement
The largest movement of any atom between two optimization steps.
RMS Displacement
The average displacement of all atoms.
When all four criteria satisfy their convergence thresholds, the optimization is considered complete.
5. Optimization Completed
If the optimization is successful, Gaussian prints

This is one of the most important messages in the output file.
It indicates that the optimization algorithm has located a stationary point on the potential energy surface that satisfies the specified convergence criteria.
If this message does not appear, the geometry optimization has not converged successfully.
6. Standard Orientation
After each optimization step—and especially at the end of the calculation—Gaussian prints the molecular geometry in the Standard Orientation.
A typical section appears as
Standard orientation:

Center     Atomic      Atomic
Number     Number      Type
---------------------------------
1          6           0
2          1           0
3          8           0
...
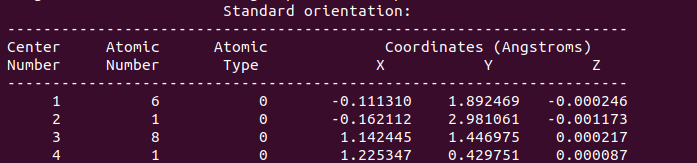
The table contains
- atom number,
- atomic number,
- atomic type,
- optimized X coordinate,
- optimized Y coordinate,
- optimized Z coordinate.
Unlike the input coordinates, the Standard Orientation is rotated and translated into a common reference frame used internally by Gaussian.
This standardized coordinate system simplifies many subsequent calculations and ensures consistent reporting of molecular geometries.
The final Standard Orientation corresponds to the optimized molecular structure and is the geometry that should be used for subsequent calculations.
7. Final SCF Energy
Near the end of the output, the final electronic energy is reported.
For example,
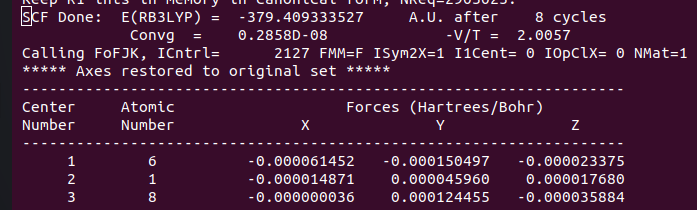
This is the electronic energy of the optimized geometry.
Unlike the intermediate SCF energies printed during optimization, this value corresponds to the final converged molecular structure.
It is commonly used for
- comparing molecular stabilities,
- calculating reaction energies,
- evaluating relative conformer energies,
- and as the starting point for further calculations.
Relationship Between Optimization and SCF
A Geometry Optimization is essentially a sequence of many Single Point Energy calculations.
The procedure can be summarized as
Initial Geometry
        │
        ▼
SCF Calculation
        │
        ▼
Calculate Nuclear Forces
        │
        ▼
Update Geometry
        │
        ▼
New SCF Calculation
        │
        ▼
Repeat Until Converged
        │
        ▼
Optimized Geometry
        │
        ▼
Final SCF Energy
Thus, every optimization step contains its own complete SCF calculation.
Summary
The Geometry Optimization output file contains all the information required to monitor the progress of the optimization and verify that a stable molecular structure has been obtained. The most important sections include the SCF energies calculated during each optimization cycle, the optimized internal parameters, the convergence criteria, the final Standard Orientation, the message indicating successful completion of the optimization, and the final electronic energy. Together, these sections confirm that the molecular geometry has been successfully optimized and is ready for subsequent calculations such as Frequency Analysis, NMR calculations, or reaction energy studies.
Next Section
In the next chapter, we examine How Geometry Optimization Works, explaining how Gaussian decides which direction to move the atoms and how it locates a minimum on the potential energy surface before discussing the underlying mathematics.