Understanding the Output File
The output of an Optimization + Frequency calculation combines the results of two separate Gaussian calculations into a single log file.
- Geometry Optimization
- Frequency Calculation
Gaussian first performs the complete geometry optimization. Once the optimized geometry has been obtained successfully, it automatically starts the frequency calculation using the optimized structure stored in the checkpoint file. :contentReference[oaicite:0]{index=0}
The overall workflow is
Input Geometry
       │
       ▼
Geometry Optimization
       │
       ▼
Optimized Geometry
       │
       ▼
Frequency Calculation
       │
       ▼
Vibrational Analysis
       │
       ▼
Thermodynamic Properties
Part I, Geometry Optimization
The first half of the output file is identical to the output produced by an ordinary Geometry Optimization calculation.
It contains
- Berny optimization iterations
- Energy minimization
- Geometry convergence
- Optimized coordinates
- Final SCF energy
For a detailed explanation of these sections, please refer to
See also
Geometry Optimization → Output File
Berny Optimization
The optimization begins with the Berny optimization algorithm.
Example
This section shows how Gaussian updates the molecular geometry until all convergence criteria are satisfied. :contentReference[oaicite:1]{index=1}

Optimization Convergence
Near the end of the optimization,
Gaussian prints the convergence table.
When all criteria satisfy their thresholds,
the optimization is complete.

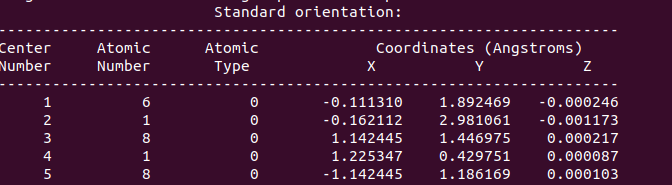
Optimized Geometry
After convergence,
Gaussian prints the optimized molecular coordinates.
These coordinates are automatically passed to the next step of the calculation.
Final SCF Energy
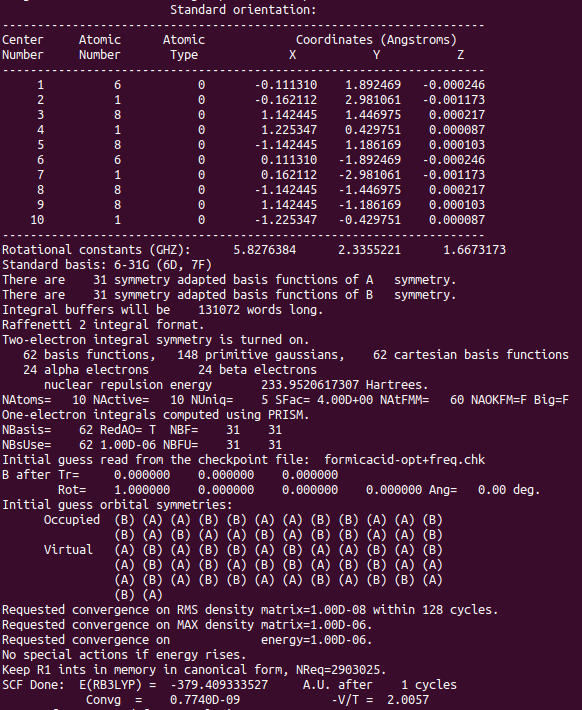
The optimized electronic energy appears as
This is the final electronic energy corresponding to the optimized molecular structure. :contentReference[oaicite:2]{index=2}
Automatic Transition to Frequency Calculation
Once the optimization finishes successfully,
Gaussian does not stop.
Instead,
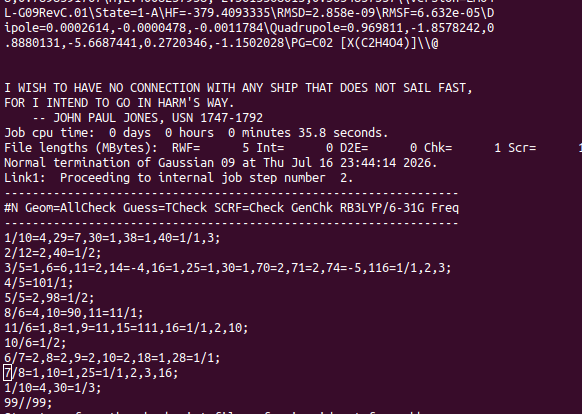
it automatically starts a new internal calculation using the optimized geometry stored in the checkpoint file.
Near the middle of the output file,
you will find
This indicates that
- the optimized geometry is read from the checkpoint file,
- the converged wavefunction is reused,
- the Frequency Calculation begins automatically. :contentReference[oaicite:3]{index=3}
Part II, Frequency Calculation
The second half of the output file is identical to the output of a normal Frequency Calculation.
It contains
- Hessian calculation
- Vibrational frequencies
- Normal modes
- IR intensities
- Thermodynamic properties
For detailed explanations,
please refer to
See also
Frequency Calculation → Output File
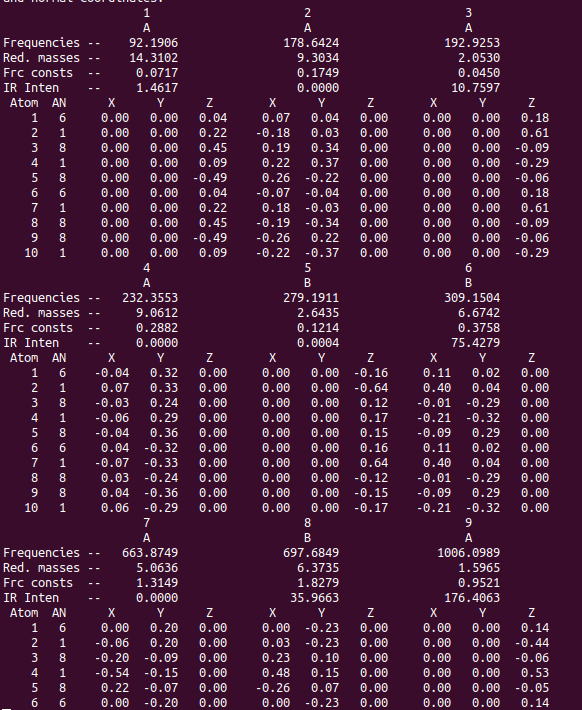
Vibrational Frequencies
Gaussian reports all calculated vibrational frequencies as
The most important point is
- all frequencies should be positive,
- no imaginary frequencies should appear.
A molecule with no imaginary frequencies corresponds to a true minimum on the Potential Energy Surface.
Infrared Intensities
Immediately below the frequencies,
Gaussian reports
These values indicate the intensity of each vibrational mode in the infrared spectrum.
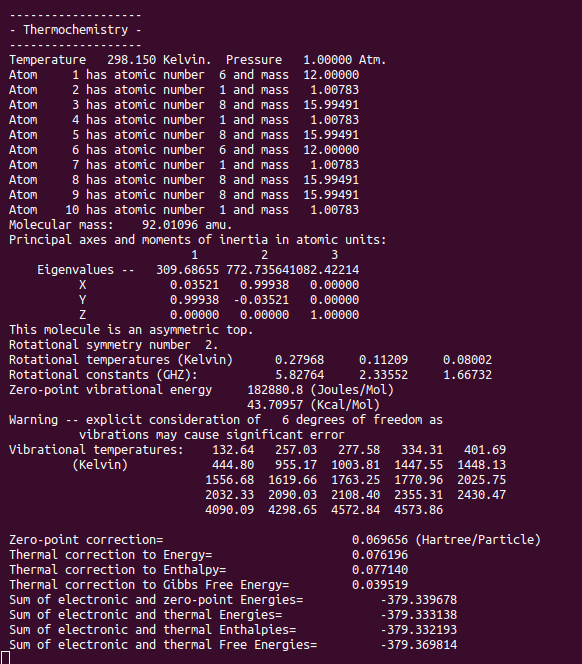
Thermodynamic Properties
Near the end of the output,
Gaussian prints
Zero-point correction

Thermal correction to Energy

Thermal correction to Enthalpy

Thermal correction to Gibbs Free Energy

Sum of electronic and thermal Free Energies
These quantities are obtained from the vibrational frequencies and are widely used in computational thermochemistry.
Normal Termination
A successful Optimization + Frequency calculation ends with
Because this job contains two internal calculations, you will observe
- one normal termination after the optimization stage,
- another normal termination after the frequency stage.
Only after the second normal termination has the complete Optimization + Frequency calculation finished successfully.
Summary
The output of an Optimization + Frequency calculation is simply the combination of two Gaussian calculations performed sequentially. The first part contains the complete Geometry Optimization, ending with the optimized molecular structure and final electronic energy. Without requiring additional input, Gaussian then starts a Frequency Calculation using the optimized geometry stored in the checkpoint file. The second part of the output reports the vibrational frequencies, infrared intensities, normal modes, and thermodynamic properties. Together, these results confirm whether the optimized structure is a true minimum and provide a complete structural, vibrational, and thermodynamic characterization of the molecule.