Output Analysis
Unlike a Geometry Optimization or Frequency calculation, an Intrinsic Reaction Coordinate (IRC) calculation does not produce a single optimized structure. Instead, Gaussian generates a series of molecular geometries along the reaction pathway, beginning at the transition state and proceeding toward both the reactants and products.
As a result, the IRC output file is much longer because the same type of information (SCF energy, forces, coordinates, etc.) is printed repeatedly for every point along the reaction path.
Most of these intermediate sections do not need to be inspected individually. Instead, attention should be focused on the sections described below.
1. Starting from the Transition State
At the beginning of the calculation, Gaussian reads the transition-state geometry supplied in the input file and constructs the initial Hessian before beginning the reaction path following.
The first few pages of the output therefore resemble a normal transition-state calculation.
The calculation then starts moving away from the transition state in small steps along the reaction coordinate.
What to Check
- The correct transition-state geometry is read.
- The SCF calculation converges.
- The IRC calculation begins successfully.
2. SCF Energy at Each IRC Point
For every point along the reaction pathway, Gaussian performs a complete electronic structure calculation.
The output repeatedly contains lines similar to
These energies correspond to the molecular structures generated along the IRC path.
Unlike a Geometry Optimization,
the energy is not expected to continuously decrease.
Instead,
the energy changes smoothly as the system moves away from the transition state toward the reactants and products.
What to Check
- Every IRC point should complete an SCF calculation.
- There should be no SCF convergence failures.
- The energy should vary smoothly along the reaction pathway.
3. Geometry of Each IRC Point
After every successful optimization step, Gaussian prints a new molecular geometry.
The output contains repeated sections such as
Each coordinate table corresponds to one point on the reaction path.
Together, these coordinate sets describe the continuous structural evolution of the molecule during the chemical reaction.
What to Check
- Atomic positions should change gradually.
- No sudden jumps in molecular geometry should occur.
- Bond breaking and bond formation should proceed smoothly.
4. IRC Integration Progress
One of the characteristic features of an IRC calculation is the progress report printed after every point.
Typical output appears as
These values indicate
- the current IRC point,
- the direction of the calculation,
- the cumulative distance travelled along the reaction coordinate.
Gaussian reports this information until the specified number of points has been reached. :contentReference[oaicite:0]{index=0}
Important Quantities
Point Number
Identifies the current point along the reaction path.
Path Number
Indicates the direction of the IRC calculation.
typically corresponds to the forward direction, while
corresponds to the reverse direction.
Reaction Coordinate
This value measures how far the calculation has progressed from the transition state.
As the calculation proceeds,
the reaction coordinate increases in magnitude until the calculation reaches a minimum.
5. Forward and Reverse Paths
After completing one direction,
Gaussian automatically starts tracing the opposite direction.
The output clearly reports
Eventually,
both directions are completed. :contentReference[oaicite:1]{index=1}
What to Check
Ensure that
- both forward and reverse paths finish successfully,
- neither direction terminates prematurely.
6. Reaction Path Summary
One of the most important sections appears near the end of the output.
Gaussian prints a summary table similar to
This table lists
- every IRC point,
- its reaction coordinate,
- its energy relative to the transition state.
The transition-state energy is taken as the reference,
and the energies of all IRC points are reported relative to it. :contentReference[oaicite:2]{index=2}
Why is this Important?
This summary provides the complete energetic description of the reaction pathway.
It is commonly used to construct
- IRC energy diagrams,
- reaction-coordinate plots,
- potential-energy profiles.
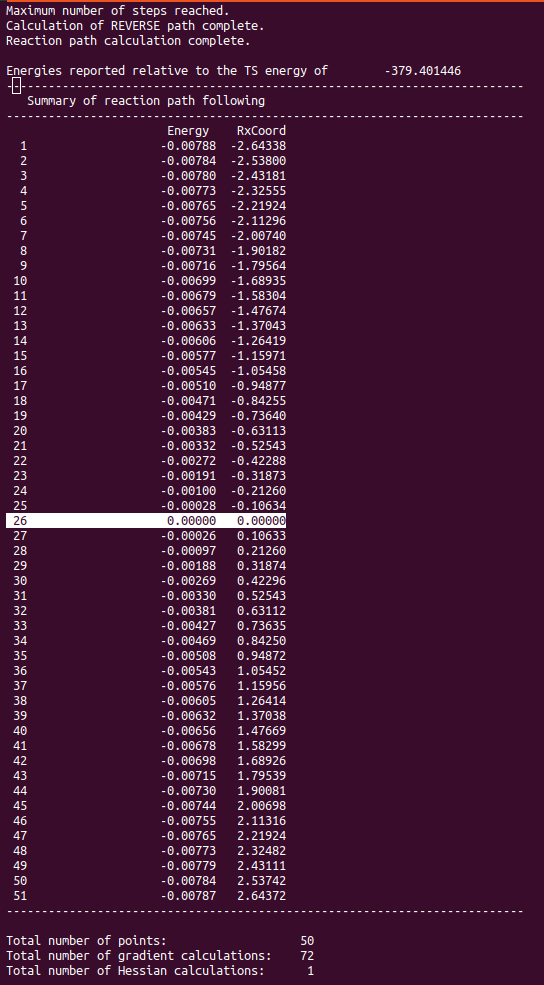
Figure 1. Reaction Path Summary table from the Gaussian output (The center point (26) is taken as TS and kept 0.0 and w.r.t. this energetics of each point either side is calculated ).
7. IRC Path Plot
The most informative representation of an IRC calculation is the reaction-path energy profile.
Instead of examining hundreds of coordinate tables,
the energies are plotted against the reaction coordinate.
A typical plot resembles
This figure immediately shows
- the transition state,
- the forward reaction,
- the reverse reaction,
- the minimum-energy pathway.
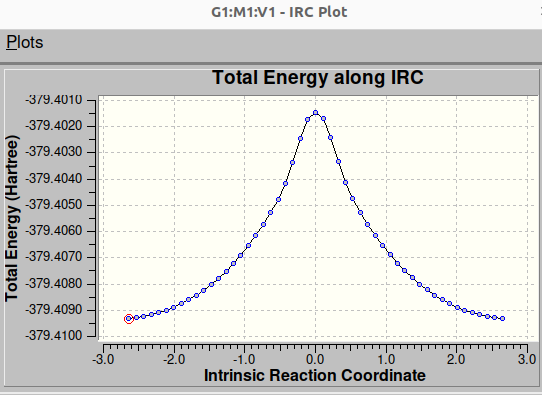
Figure 1. IRC Energy Profile (Energy vs Reaction Coordinate).
8. Molecular Motion Along the IRC
Perhaps the most useful visualization is the molecular animation generated from the IRC points.
Because every IRC point corresponds to an optimized geometry,
the complete reaction pathway can be animated in GaussView or another molecular visualization program.
The animation shows
- bond formation,
- bond breaking,
- proton transfer,
- molecular rearrangement,
exactly as they occur along the reaction pathway.
Unlike the imaginary vibrational mode obtained from a frequency calculation,
this animation represents the actual minimum-energy reaction pathway.
Video 1. Molecular structures evolving along the IRC pathway (GaussView animation).
9. Successful Completion
At the end of the calculation Gaussian prints
This indicates that
- the forward IRC terminated successfully,
- the reverse IRC terminated successfully,
- the complete reaction pathway has been generated. :contentReference[oaicite:3]{index=3}
Checklist
A successful IRC calculation should satisfy the following conditions.
- ✅ SCF converges at every IRC point.
- ✅ Molecular geometries change smoothly.
- ✅ Forward path completes successfully.
- ✅ Reverse path completes successfully.
- ✅ Reaction path summary is printed.
- ✅ Energy varies continuously along the reaction coordinate.
- ✅ The generated structures connect the expected reactants and products.
Summary
Unlike most Gaussian calculations, an IRC calculation produces a sequence of optimized molecular structures rather than a single final geometry. The most important parts of the output are the IRC progress information, the forward and reverse path completion messages, and the final reaction-path summary. These results allow the user to construct an energy profile, visualize the structural evolution of the molecule, and verify that the transition state connects the correct reactants and products. In practice, the IRC energy plot and the molecular animation are the two most valuable outputs of an IRC calculation, as they provide a clear picture of both the energetics and the mechanism of the chemical reaction.